Cargando...
Que puis-je faire ?
Trouvez
visualisation
To create news related to the subject of population and migratory movements, organised into editing committees (groups of three), and to publish them in the Class Blog. There are three options for cre ...
We are going to study and learn more about all aspects of poverty. We are going to discover the inequality there is in the world and how we can come across situations of need and hardship anywhere in ...
Includes concepts such as: reading and creating tables and graphs

Includes concepts such as: reading and creating tables and graphs
We are going to study and learn more about all aspects of poverty. We are going to discover the inequality there is in the world and how we can come across situations of need and hardship anywhere in ...
Through language we are able to communicate with each other. The most common forms of language are: oral, written and graphical. Nowadays, graphics represent one way of expressing and transmitting inf ...
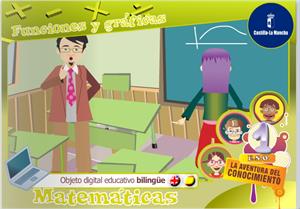
Unidad didáctica interactiva centrada en la enseñanza y el aprendizaje de las funciones y gráficas para 1º de Educación Secundaria. Es un recurso bilingüe en el q ...

Hipervinculo Matemáticas
Material pedagógico en inglés diseñado para mejorar la lectura y elaboración de tablas y gráficos. Tables and graphs es un material educativo publicado en Agrega, un repositorio de contenidos educat ...
Secuencia pedagógica sobre la presentación y la interpretación de la información mediante la creación y lectura de tablas de datos gráficos como los polígonos de frecuencias y las gráficas del sector ...
Hipervinculo Matemáticas
Explicaciones con ejemplos para que sepamos interpretar y crear gráficos de sectores con tablas de frecuencias absolutas o relativas. 'Practise creating and interpreting sector graphs based on absolu ...
Ajouter à Didactalia Arrastra el botón a la barra de marcadores del navegador y comparte tus contenidos preferidos. Más info...