
Cargando...
What can I do?
226313 materialEducativo
textoFiltroFichatipo de documento Mathematics - Experiment/Lab
About this resource...
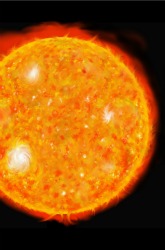
Sunspots are disturbed areas of the sun that look like spots because they are cooler than the surface of the sun. They have been observed and recorded since the 18th Century. This large collection of data can be used to look for patterns and possible equations to how sunspots work. This experiment will explore how manipulating a graph of historical information might reveal new information about data.
It is an educational content by education.com.
By clicking on the title of this resource, you will be redirected to the content. If you want to download the project, you just have to join the website, which now is for FREE.
Exclusive content for members of
Mira un ejemplo de lo que te pierdes
Autores:
Categories:
Tags:
Fecha publicación: 12.5.2016
The original license is kept.
Add to Didactalia Arrastra el botón a la barra de marcadores del navegador y comparte tus contenidos preferidos. Más info...


Comment
0