
Cargando...
Que podo facer?
Atopa
visualización
Video Matemáticas
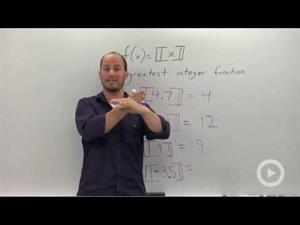
"Some functions are not easily written as a formula. On a graph, a step function looks like a flight of stairs. The graphs of step functions have lines with an open circle on one end and a closed circ ...

Hipervinculo Matemáticas
"In science classes we will often find ourselves graphing logarithmic functions to describe situations such as motion or speed over time. When trying to identify these situations as those seen in grap ...

Hipervinculo Matemáticas
"Permutations and combinations occur when we are trying to find the probability of a certain event happening. When working with statistics combinations, we are trying to find the number of possible co ...

Hipervinculo Matemáticas
"We use many different techniques to graph lines, but one of the most efficient and straightforward, when given the equation of the line, is graphing lines using intercepts. If we are not given a tabl ...

Hipervinculo Matemáticas
"When given a list of numbers, we are often asked to find its statistical range. The statistical range of a list of numbers is the highest value minus the lowest value, and it describes how much the l ...

Hipervinculo Matemáticas
"When first introduced to graphing lines, we often use a table of values to plot points and connect them. There are several other methods of graphing lines, including using a point and the slope. Some ...

Hipervinculo Matemáticas
"It can be convenient to calculate the likeliness of an event occurring, and in many cases we can use statistical probability. We often encounter this in problems involving card games or dice rolling. ...

Hipervinculo Matemáticas
"When given a list of numbers, we are often asked to find the statistical mode. The statistical mode is the most commonly occurring number in a list, and if more than one number occurs with the same f ...

Hipervinculo Matemáticas
"In order to understand graphing inverse functions, students should review the definition of inverse functions, how to find the inverse algebraically and how to prove inverse functions. The graphs of ...

Hipervinculo Matemáticas
"Just like equations, sometimes we have two variables in an inequality. Graphing inequalities with two variables involves shading a region above or below the line to indicate all the possible solution ...
Engadir a Didactalia Arrastra el botón a la barra de marcadores del navegador y comparte tus contenidos preferidos. Más info...


