
Cargando...
¿Qué puedo hacer?
226261 materialEducativo
textoFiltroFichaAcerca de este recurso...
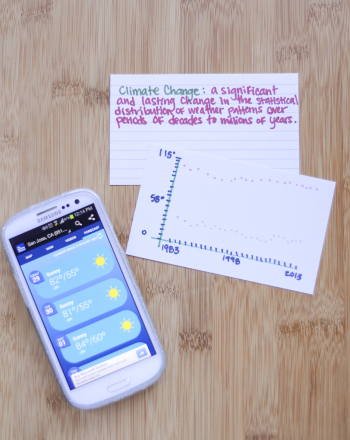
Standard deviation is a statistic that tells you how closely a group of numbers (for example, temperatures) are clustered around a mean value (average temperature). When the standard deviation is small, the numbers are fall close to the mean. When the standard deviation is large, the individual values are spread out far from the mean.When expressing the mean of a set of temperature values, it is helpful to give the standard deviation as well. If the mean temperature value has a large standard deviation associated with it, it probably means there were large fluctuations in the data. If, on the other hand, the standard deviation is small, the temperatures measured were probably fairly uniform.To calculate standard deviation, subtract the average value from each number in your set, and then square each of the differences. Sum up all of the squares and divide by the number of values in the set. Then take the square root.
It is an educational content by education.com.
By clicking on the title of this resource, you will be redirected to the content. If you want to download the project, you just have to join the website, which now is for FREE.
Contenido exclusivo para miembros de
Mira un ejemplo de lo que te pierdes
Autores:
Categorías:
Etiquetas:
Fecha publicación: 12.5.2016
Se respeta la licencia original del recurso.
¿Quieres comentar? Regístrate o inicia sesión
Añadir a Didactalia Arrastra el botón a la barra de marcadores del navegador y comparte tus contenidos preferidos. Más info...


Comentar
0